

Data analysis and automated financial reporting bespoke software
Global metal trader's reporting system revolutionized, enhancing efficiency and data accuracy with automated, user-friendly financial analysis software.
Our Client.
Our client is a global organization dealing with the trade of metals across many industries around the world.
The challenge
To carry out their day-to-day processes, our client used a variety of software systems to store and process data of different types. None of these systems focused on financial reporting. This presented us with a challenge to find a way to accommodate and unite all of the relevant data into an appropriate system for producing business intelligence reports.
Our client’s manual method of generating reports every day presented several challenges. Firstly, this system was time consuming and exposed files to the risk of human error. Secondly, this system often caused delays for accessing reports due to the global dispersal of our client’s offices. Thirdly, this created significant challenges for producing regular and detailed audits of their work. This responsibility is required by their membership obligations to the London Metal Exchange.
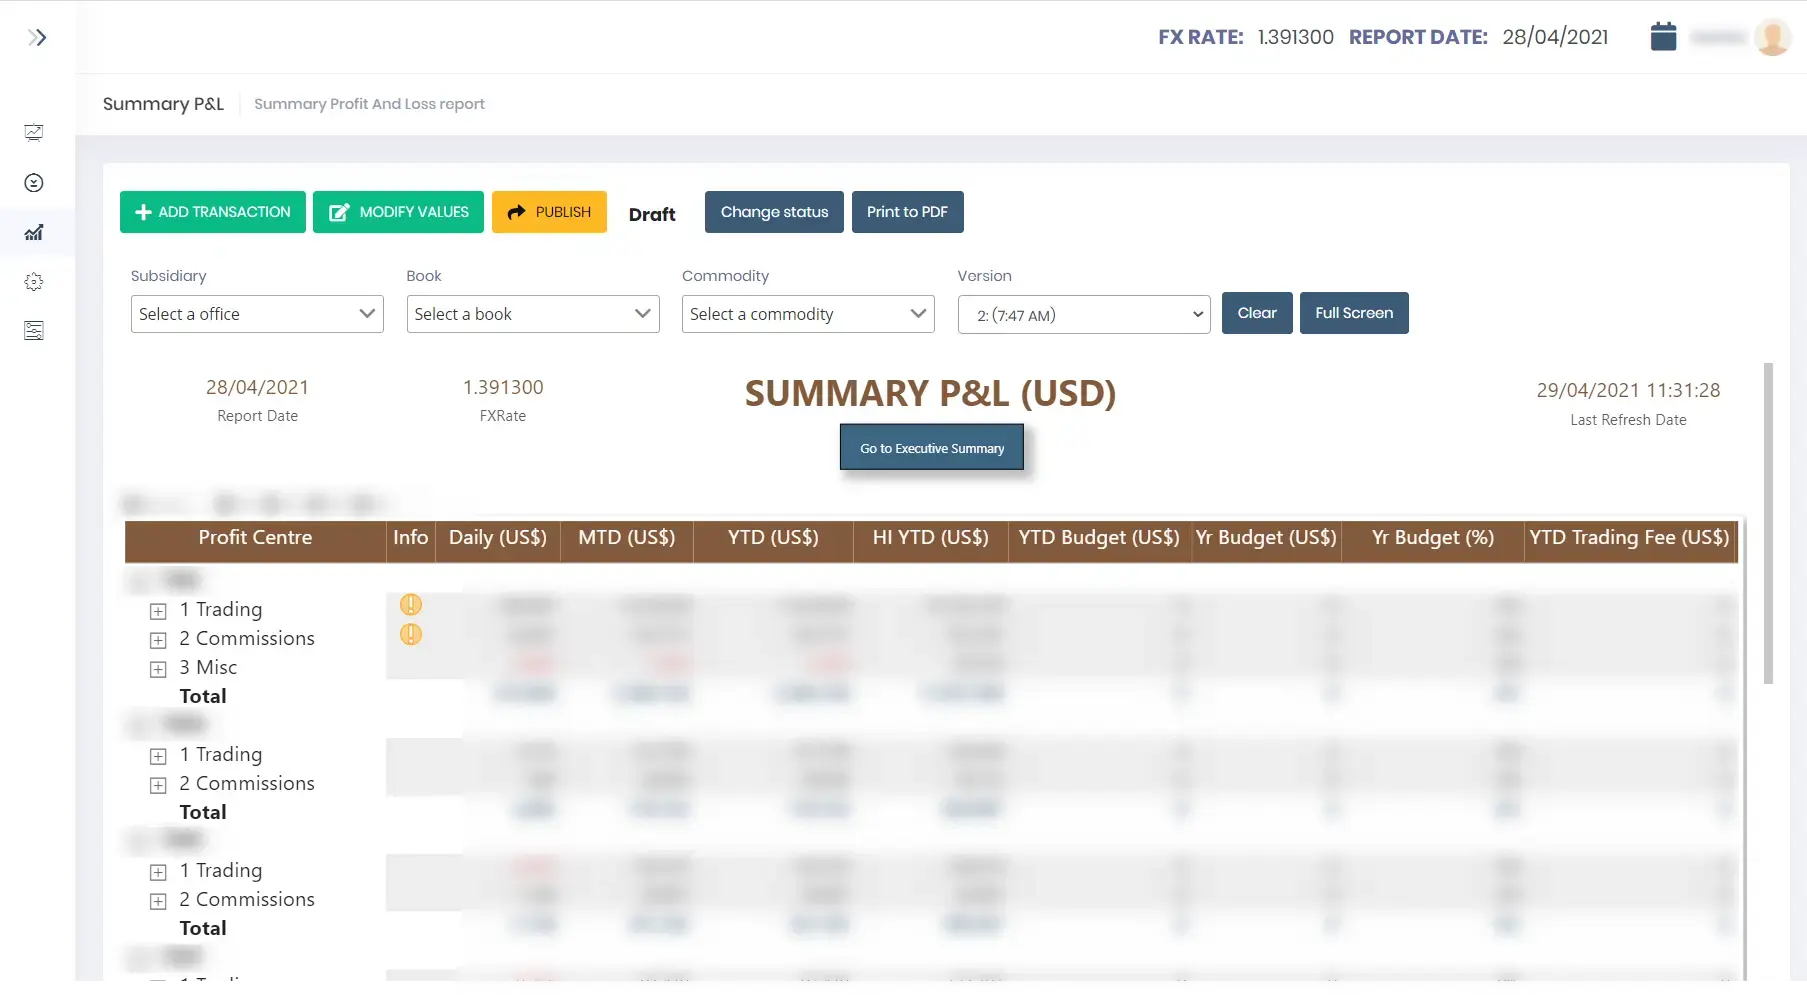
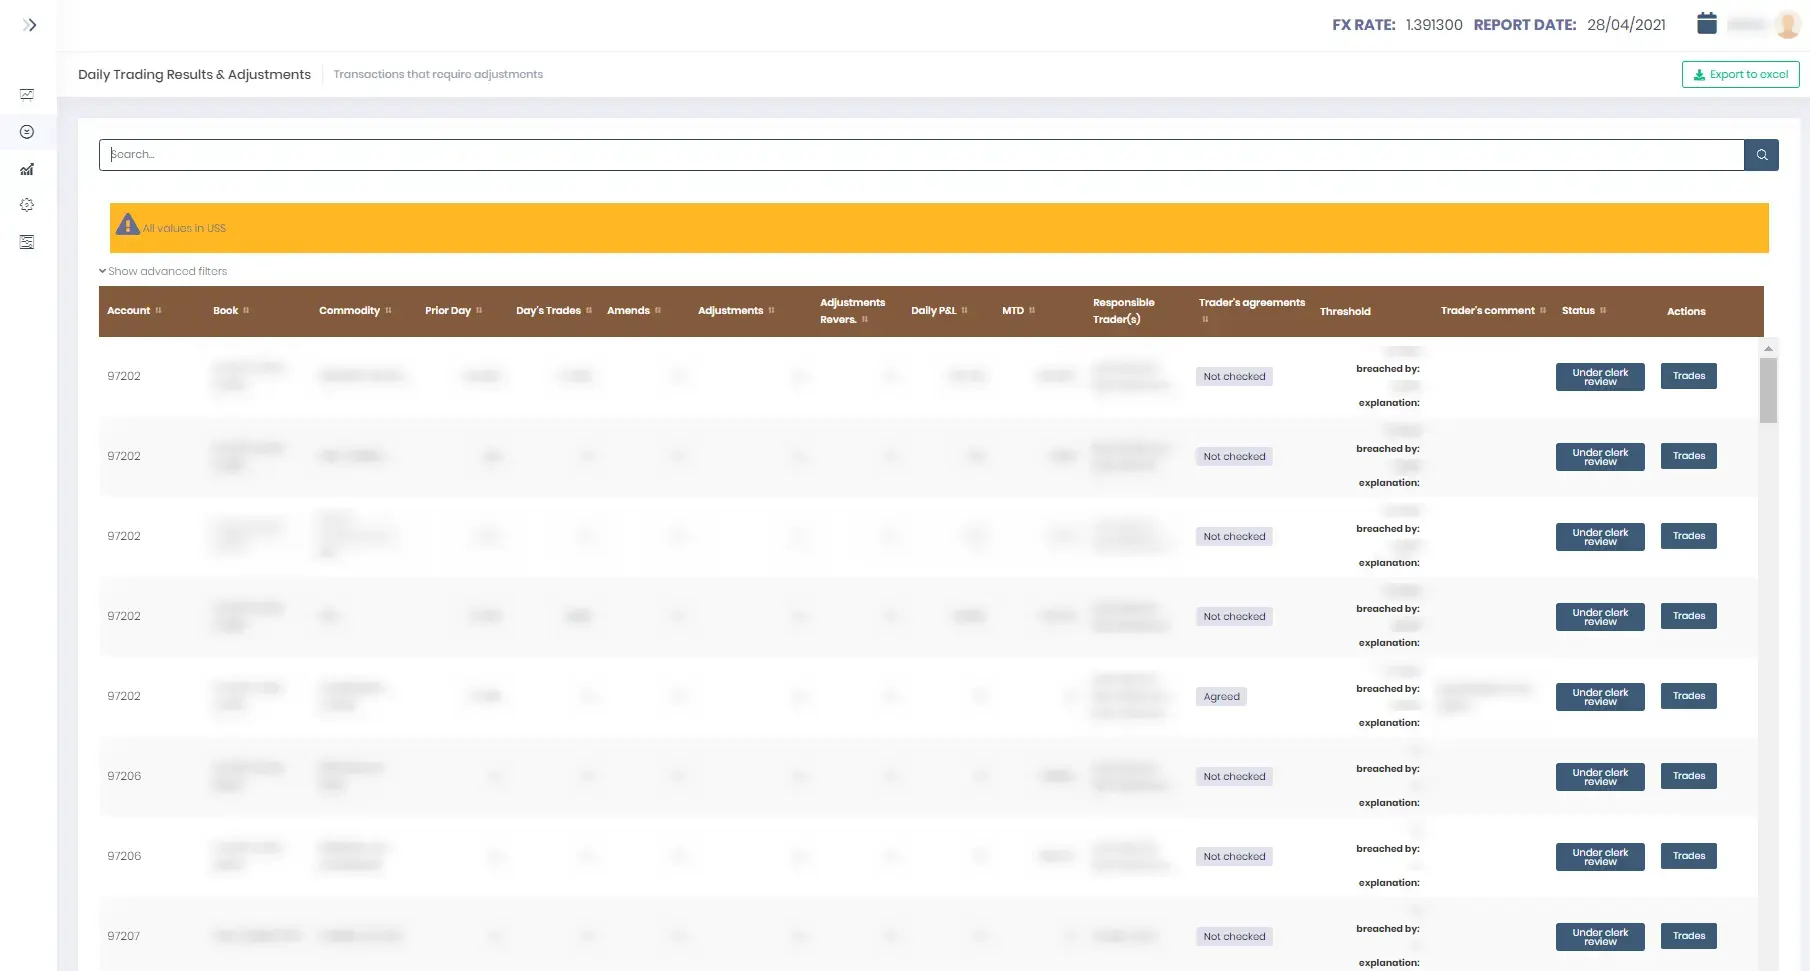
Prior to working with our client, their Profit and Loss (P&L) report involved the physical retrieval of all the necessary signatures and information about Traders by one member of staff, every day. The report was then generated manually. Traders would use these reports to check information about their previous day’s trades and confirm if they were correct or not. If not, they would leave a comment with the correct value. Clerks would then have to check reports and alter them if necessary. This became a very inefficient method of handling P&L information.
Our mission
We were asked to help our client overcome the challenges they were facing by developing software to produce their business intelligence reports. This system would produce P&L reports for every trading card, and a consolidated daily P&L report combining all trading cards.
The breakdown
To suit the particular needs of our client, our system needed to feature a number of key requirements. These included;
- Integration compatibility with CM2; a global enterprise measure for configuration management that our client uses within their organization.
- The ability to import all historical data for the last financial year
- Access to P&L reports by traders
- A drilldown function to hone in on details and performance monitoring to enable more dynamic P&L analysis
- The ability to gather source data from CM2 while data integrity remains stable
- Multiple currency reporting features. This was particularly important in light of the different currencies used within our client’s international organization.
- Performance monitoring functions using dashboards
- Offline reporting to Excel
- The option to accommodate more business areas like NCE and Liquidity.
- The option to allow new sources of data to be added
Our method
To deliver the best service for our client, we held several workshops to understand their needs and discuss our recommendations. These workshops were held virtually and in person, to suit our client’s availability.
To include our client in the development process and promote transparency, we produced comprehensive prototypes using UXPin to give them an insight into the solution we were working towards. We also presented them with our progress after each iteration, using the Agile methodology. Taking these steps gave them the chance to highlight any parts they wanted to change before reaching the final stages of development.
Finally, we gave our client the flexibility to choose the specific calculation method that best suited them.
Our solution
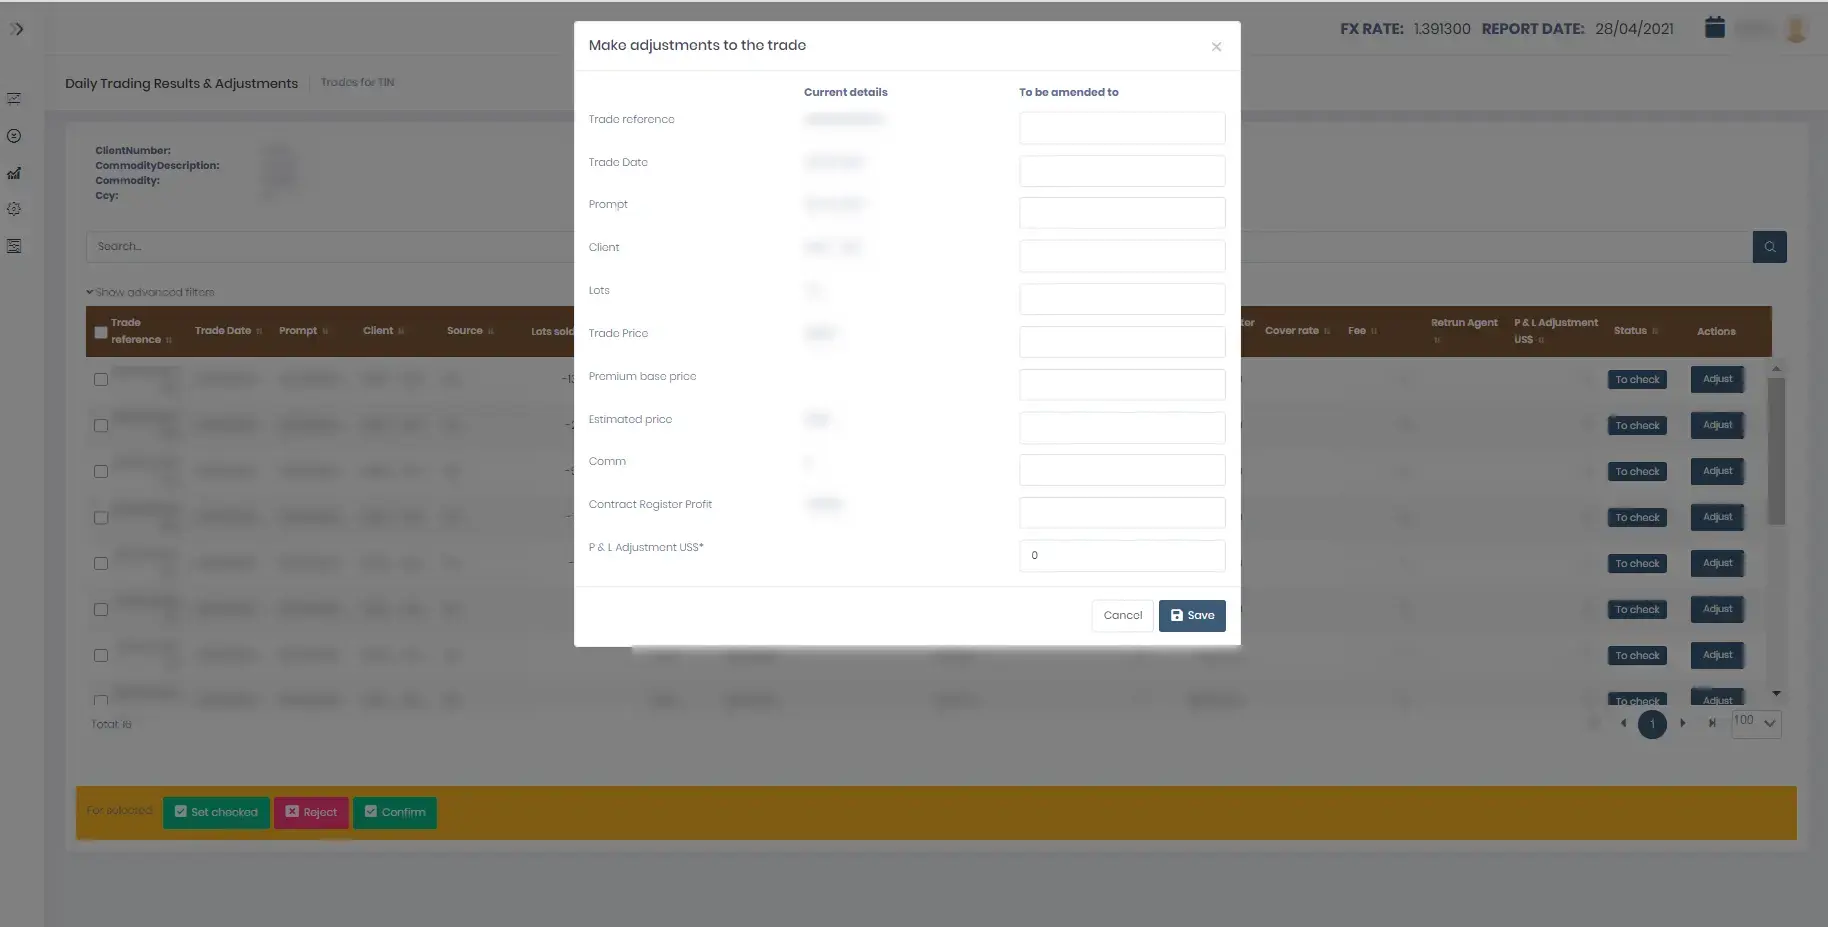
To resolve the challenges our client was facing, we developed a web application that is accessible only through our client’s network. This application integrates with CMII to gather information and produces expected reports on a daily basis. If any adjustments are needed, reports can be modified by pre-selected users who are given privileged access to the application. Each version of the report is stored within the system, so that changes can be tracked and compared against the original version. The system also simplifies the client’s extensive auditing duties by producing automatic audit logs.
We developed this application using SCRUM methodology, and chose Microsoft Power BI to generate reports. SCRUM was effective in helping us to maintain flexibility as we adjusted to different requirements and modifications during development.
Our journey
During the development of our project, we needed to overcome many obstacles to guarantee the success of our final solution. Our journey is discussed in more detail below;
Obstacle 1: Integrating Power BI
Problem: The reporting service Microsoft Power BI, was selected to support the analysis of a large dataset of financial information. This posed a challenge for us as it was not clear if the system would support the required data latency time, and the ever-increasing number of transactions to be analysed. Our client however, expected a high level of responsiveness from this service. They also wanted the option to drill-down to the details of their reports.
Power BI can be operated in different ways; the ‘Direct Query’ and the ‘Import’ mode. The Direct Query mode can execute a single SQL query every time a user interacts with the visualization, however this mode causes major delays in response time. Import mode on the other hand, collects all of the relevant data during a dataset refresh. While this provided users with instant access to data, the data they were analysing was never up to date.
Solution: We developed a simulation of the data quantity and conducted performance tests to discover if and how to best integrate Power BI into our application. We did this by comparing response times using both modes of the response service using the expected data quantity.
This simulation confirmed that integration was possible with Power BI, but we needed to make a switch from the Direct Query mode to the Import mode to speed up response times.
Implementing the Import mode resulted in a number of unforeseen challenges;
Whenever the data changed, we had to carry out additional API requests to force Power BI to refresh the dataset. We were unable to attain confirmation from the API when the dataset was refreshed. Instead, we had to modify our reports to display this information. Power BI does not facilitate a smooth transition from one mode to the next, so we had to recreate the entire data model in Power BI. To ensure the dataset did not become too large for Power BI to support it, we needed to implement archival rules. We had to schedule additional dataset refreshes in Power BI to support the server if API requests failed.
Obstacle 2: The corruption of Power BI using two gateways
Problem: Power BI uses a model with a ‘Gateway’ installed on the server with internet and data source access. The server uses this gateway to collect data for reports.
It was discovered that in some situations, installing an additional Power BI Gateway to use with the same data source can result in Power BI failing to execute a dataset refresh. This problem was difficult to identify because the configuration in the Microsoft Portal did not expose the issue.
Solution: This challenge was overcome by re-installing the second gateway.
Obstacle 3: Using Text Files in CMII
Problem: Our client used CMII, an old-style transactional system, to store information within multiple text files. Text files were produced as an output at the end of each working day, and they were generated every night. If the overnight data was not successfully synchronized, this risked the data becoming incoherent overall.
Solution: To mitigate this risk, we ensured that the synchronisation process was monitored closely so that errors could be identified as soon as they emerged. We also suggested that project data should be produced using SQL tables/views that we could connect to. This new system sends notifications every time a synchronization is complete. Additionally, users are given the option to rollback and re-import data if it becomes corrupted. Previous results are stored in a temporary table for a significant period of time to ensure that if something went wrong, we could download source data and process it.
Obstacle 4: The Source Database
Problem: The input database was not available by the time we had scheduled to start our project. As well as setting our team and our project back, this was particularly problematic because we had booked developers to begin their work at this time.
Solution: We decided to develop a mock of the input database, using fake data. This allowed us to streamline our development process and avoid delays. This solution however, resulted in some inconsistencies with the data model when the real database was introduced. We were forced to backtrack and redo parts of the job that we had already worked on. This increased the overall time and money spent on the project.
Obstacle 5: The Data Model Structure
Problem: Our client wanted us to develop a dynamic data structure, however this was not supported by the Power BI system.
Solution: We attempted to develop a dynamic data structure within Power BI, however this delivered poor performance. After discussions with our client, we decided to instead make the report’s structure static. While this made the system less user-friendly, user training sessions would help to resolve this problem.
Obstacle 6: Standards and Algorithms
Problem: The algorithms used for calculating the values of reports were not standardized, as it was discovered that there was no common method for calculating the results per section.
Initially we were told that different sections of the reports could be calculated using the same algorithm, but we discovered this to be false. The calculations also tended to change from time to time, to allow for the analysis of new KPIs.
Solution: We decided to link calculation algorithms with the report structure. As the structure of reports changed frequently, we had to allow the structure to be flexible and configurable. This led us to store the calculation algorithms in the database engine, instead of in the application source code. Ideally, additional modules would be needed to support an even more flexible configuration of the report structure.
Obstacle 7: Poor Quality of Input Data
Problem: The quality of input data from the CMII database and from manual input was poor. This meant that our solution needed to effectively manage human error, and accommodate multiple exceptions to data handling procedures. Doing this meant that we could not set strict limitations on data formats for different data fields. As a result, the performance of our system became restricted. Further, multiple checks were required before calculations could be made.
Solution: As CMII did not deliver all the required input data to generate reports, we had to implement additional features to provide a manual reporting function of transaction details. This carried a risk of human error however due to the nature of manually input data. The risk of error was worsened by the complex business rules our client had to adhere to.
To resolve this challenge, we decided that our system would accept all the input data from users and implement an additional business workflow. This would require the confirmation of data by other users like Traders or Clerks in the process, instead of implementing the full business logic.
A story of success
Our solution has transformed our client’s reporting system in a variety of ways. These benefits are discussed below;
- Reports are now generated automatically. This saves our client time and effort, and reduces the risk of human error. Reports are now produced within five minutes instead of a few hours.
- Audit trails can now be produced instantly and automatically.
- Once reports are produced, all users can access reports immediately. Employees in countries around the world are no longer faced with delays.
- Users have access to present and historical reports, which helps if they need to compare or analyze data over time.
Project facts
- Team – Developers 4 (Team Leader 1, Backend dev 3), DevOps 1, QA 1, BA 1, PM 1
- Project management – Scrum for production and Kanban for maintenance
- Technology – Asp.Net Core, EntityFramework Core, MS SQL, Angular, Metronic, Bootstrap